
The proportion of all workers’ compensation claims registered as no-lost-time claims in the province of Ontario, Canada, increased from 56 per cent in 1991 to 68 per cent in 2006.
In Ontario, as in other settings in North America, there are concerns about the reliability of workers’ compensation administrative records as a source of surveillance information on the incidence of work-related injury and illness. These concerns centre on the integrity of workplace reporting of work-related injury and illness among particular groups of workers or for certain types of injuries, as well as concerns about the exclusion of some classes of workers (self-employed and independent contractors) from insurance coverage.
A number of research studies in Ontario have compared workers’ compensation lost-time claims data to other sources of information on the incidence of work-related injury and illness. One study reported that the incidence of lost-time compensation claims declined by 28.8 per cent from 1993 to 1998, while the incidence of self-reported work-related injury declined by 28.2 per cent, and the self-reported incidence of work absence for work-related causes declined by 32.2 per cent (Mustard et al., 2003). A more recent study comparing the incidence of emergency department visits for the treatment of work-related disorders to the incidence of lost-time workers’ compensation claims found an equivalent decline of 17 per cent in emergency department visits and lost-time claim incidence from 2004 to 2008 (Mustard et al., 2011).
Workers’ compensation claims may be divided into two broad categories:
- those that involve taking time off work, or “lost-time claims” (LTCs); and
- those that do not involve taking time off work, or “no-lost-time claims” (NLTCs).
LTCs should typically be more serious and less frequent than NLTCs. But does the ratio between the incidence of LTCs and NLTCs stay fairly constant over time, or does it vary? If it varies, what factors explain the changing relationship? Have the types of injuries associated with these types of claims changed over time? When workers’ compensation premiums paid by employers depend on their claims experience, is more attention paid to preventing LTCs (which have a greater impact on claims costs) than NLTCs? Are injured workers better accommodated to avoid time off from work? Are LTCs being suppressed or serious injuries being reported as NLTCs to avoid higher premiums?
Some of these questions were examined in a research project recently completed at the Institute for Work & Health. Led by Dr. Peter Smith, the research described characteristics of no-lost-time claims in Ontario from 1991 to 2006. In this Issue Briefing, we summarize the main findings and implications of this research.
Lost-time and no-lost-time claims in Ontario
In Ontario, the Workplace Safety and Insurance Board (WSIB) provides wage-replacement benefits and health-care payments for work-related injuries and illnesses. A work injury or illness is classified as “lost time” if, after the day of injury or onset of illness, the worker is absent from work or not absent from work but earning less pay (as a result of reduced hours of work or lower wages).
A work injury or illness is classified as “no lost time” if the worker requires health care (arising from the work injury or illness), but is not absent from work other than the day of injury, and suffers no loss in pay as a result of the injury.
Under existing legislation in Ontario, the types of injuries that should be submitted as no-lost-time claims are:
- less severe injuries (that require health care but not time off work);
- injuries where the worker cannot return to his/her normal duties the next day, but can do another job or his/her own job with modifications, and the worker remains on full pay (sometimes referred to as “accommodation”); and
- claims submitted as a result of chronic work-related diseases, after the worker has stopped participating in the labour force (i.e. retired).
Insurance premiums paid by many employers in the Ontario workers’ compensation system are experience-rated: the premiums paid by the employer are adjusted to reflect the costs of claims made over the preceding three years, relative to the average costs of firms in the same rate group (i.e. facing similar risks). LTCs are given more weight than NLTCs in the determination of the experience-rated portion of employers’ workers’ compensation insurance premiums based on the assumption that LTCs are more serious injuries and are likely to lead to greater future costs.
Claim trends, 1991-2006
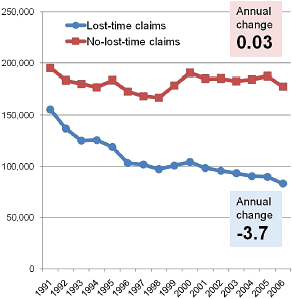
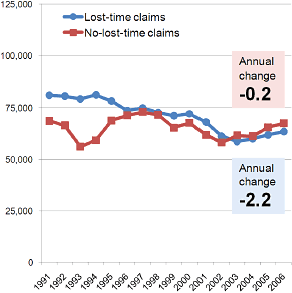
Accepted lost-time claims fell much more rapidly than no-lost-time claims in Ontario from 1991 to 2006. There were 155,475 accepted LTCs in Ontario in 1991 and 83,179 in 2006, representing an annual reduction of approximately 3.7 per cent over this period. Over the same period, there was no meaningful reduction in accepted NLTCs. In British Columbia, the reporting of lost-time claims declined by approximately 2.2 per cent per year, and the reporting of no-lost-time claims declined by 0.2 per cent per year (see Charts 1 and 2 above).
Using claims data from the WSIB and data on hours worked in each industry from Statistics Canada’s Labour Force Survey, the Institute for Work & Health study team computed the rate of LTCs and NLTCs per full-time-equivalent (FTE) worker (adjusted for the incomplete coverage of the workers’ compensation system in Ontario) for each industry in each year from 1991 to 2006. Industries with voluntary coverage, or that were self-insured but required to report to the WSIB, were excluded from the study.
The rate of NLTCs per 100 FTEs fell from 6.54 in 1991 to 4.91 in 2006. The rate of LTCs fell from 4.58 to 1.85—a much steeper drop. The ratio of NLTC to LTCs, averaged over the 16-year period, differed markedly by economic sector. The highest ratios of NLTC rates to LTC rates were found in mining/utilities (2.57), construction (2.41) and manufacturing/transportation/warehousing (2.13). The lowest NLTC/LTC ratios were found in agriculture/forestry (1.38), health care/social assistance (1.51), and retail trade (1.57). The ratio of NLTC to LTC was higher for men (2.13) than for women (1.58).
The study conducted regression analyses to estimate the effect of one variable on another, while controlling for the effects of other influences. LTC rates and NLTC rates were each, separately, related to age, gender, industry and other factors (such as unemployment rate and job tenure). These analyses confirm that different factors are associated with a higher risk of no-lost-time claims and lost-time claims. As such, ranking labour market subgroups using LTCs will lead to different results than using NLTCs.
Trends in health-care use and costs for NLTCs
Trends in health-care expenditures associated with NLTCs may also help us understand the patterns we see in the claim rates. Did the shallow decline in the rate of NLTCs (compared to LTCs) in Ontario between 1991 and 2006 reflect improved protection of workers from the risk of serious injury, better accommodation of disability arising from work injuries, or changes in the injury-reporting practices of firms? For example, if workplace accommodations were responsible for the rising share of NLTCs over time, we would expect the average health-care costs of NLTCs to rise, reflecting an increasing average severity of injuries among claimants returning to work the day after their injury.
Health-care expenditures described in this study excluded costs of treatment in an emergency department of a hospital, most services provided by primary care physicians, or services provided by health-care practitioners employed by the workplace where the claimant was injured. Average (mean) health-care costs per NLTC fell between 1991 and 1997, then rose between 1998 and 2006. The increase in health-care costs per claim after 1998 was greater for firms with over 100 full-time-equivalent workers than for smaller employers. The change coincided with policy changes to the workers’ compensation program in Ontario designed to emphasize the responsibility of the workplace parties to manage the return-to-work process after a work injury. The new legislation took effect at the beginning of 1998.
The finding of increasing health-care spending per NLTC since 1998 is consistent with the hypothesis that the shallow decline in the rate of NLTCs (compared with LTCs) during this time period is explained in part by workers returning to work the day after injury with injuries that, in the past, would have resulted in lost time. This hypothesis is also supported by the finding that health-care costs per NLTC rose more in larger firms, perhaps because larger enterprises are better able to provide modified work arrangements.
Trends in injury types for NLTCs
Trends in the types of injuries associated with NLTCs may also shed light on the factors responsible for the divergent trends in LTCs and NLTCs. If workplace occupational health and safety practices were increasingly effective over this period, we would expect an equivalent reduction in all types of injuries submitted as no-lost-time claims. On the other hand, if workplace accommodation practices (or workplace claims management practices) were increasingly common over this period, we would expect that a greater share of NLTCs would have a more severe injury profile over time.
In this part of the study, the project team manually coded approximately 10,000 NLTCs. Each claim record was reviewed and classified to define the principal physical characteristics of the injury or disease (e.g. heat burns, amputations, bruises or contusions, fractures) and the event leading to injury (e.g. bending, contact with fire, fall from roof, struck by object). Records were selected for four sample years: 1991, corresponding to the time period before experience rating was universally applied in Ontario; 1996, after the experience rating program (NEER) became mandatory; 2000, after the legislative changes of 1998 to promote early return to work; and 2005, a recent injury year.
The distribution of claim types did not change markedly across injury years. Overall, there was no evidence of a large increase in severe injuries being reported as no-lost-time claims over the time period.
Conclusion
The study summarized in this Issue Briefing used an observational research design based on administrative records of workers’ compensation claims to identify evidence in support of three explanations for the rising proportion of compensation claims registered as no-lost-time claims in Ontario. Did the shallow decline in the rate of NLTCs (compared to LTCs) in Ontario between 1991 and 2006 reflect improved protection of workers from the risk of serious injury, better accommodation of disability arising from work injuries, or changes in the injury-reporting practices of firms?
The ratio of NLTC to LTCs, averaged over the 16-year period, differed markedly by economic sector. The lowest NLTC/LTC ratios were found in agriculture/forestry, health care/social assistance, and retail trade. The highest ratios of NLTC rates to LTC rates were found in mining/utilities, construction and manufacturing/transportation/warehousing. Workers’ compensation insurance premiums in most rate groups in these three economic sectors are generally higher than the provincial average. The higher NLTC to LTC ratio in these three sectors would be consistent with the hypothesis that higher insurance premiums are influencing employers in these sectors to prevent serious injuries and/or to return injured workers to the workplace the day after injury.
Health-care expenditures per NLTC slightly decreased between 1991 and 1997 and increased between 1998 and 2006. The increase in health-care costs per NLTC after 1998 was, on average, greater for firms with over 100 full-time-equivalent workers than for smaller employers. These findings are consistent with the hypothesis that improvements in workplace accommodation of disability arising from work injuries (or an increase in the use of claims management practices) are responsible, in part, for the increasing proportion of all workers’ compensation claims registered as no-lost-time claims. The data do not allow us to distinguish between accommodation practices and claims management.
In contrast, the study did not find evidence of a change over time in the types of injuries registered as no-lost-time claims. The pattern of stability over time in injury event and injury severity was consistent for small, medium and larger employers. The study did document a small increase in the proportion of all NLTCs that were attributed to non-traumatic causes (exposure to repetitive motion and static posture), from 2.2 per cent in 1991 to 5.7 per cent in 2006. This increase was consistent for small, medium and larger employers. While difficult to interpret with certainty, the findings from this phase of the study do not indicate a substantial increase over time in the severity of injuries registered as no-lost-time claims.
In conclusion, while sector differences in the ratio of NLTCs to LTCs may be due, in part, to sector-specific workplace hazards, sectors with a higher proportion of NLTCs may be more active in returning injured workers to the workplace the day after their injury. On the basis of patterns in health-care expenditure, there was some indication that the severity of NLTC injuries increased over time. However, the study did not identify a corresponding change in the types of injuries submitted as NLTCs.
We suggest two implications arising from this study. First, occupational injury prevention strategies that rely on compensation claims data for surveillance and targeting may be wise to rely on a composite measure that combines information on both more-serious and less-serious compensable injuries.
The second implication speaks to the quality of information available on the use of modified duty practices. In Ontario, as in many Canadian workers’ compensation systems, limited information is available from compensation claims administrative records concerning the practice of accommodating disabled workers through the use of modified duty arrangements. Given the increasing adoption of these practices in workplaces in all economic sectors, it may be prudent to consider means by which workers’ compensation records could include information on the use of modified duties and the outcomes of disability episodes managed in whole or in part by these arrangements.
References
- Mustard CA, Cole D, Shannon H, Pole J, Sullivan TJ, Allingham R. Declining trends in work-related morbidity and disability, 1993–1998: A comparison of survey estimates and compensation insurance claims. Am J Public Health, 2003; 93:1283-1286.
- Mustard CA, Chambers A, McLeod C, Bielecky A, Smith PM. Comparison of two data sources for the surveillance of work injury. Institute for Work & Health, February 2011.
- Smith P, Chen C, Hogg-Johnson S, Mustard C, Tompa E. Trends in the health care use and expenditures associated with no-lost-time claims in Ontario: 1991 to 2006. Journal of Occupational and Environmental Medicine, 2011; 53(2):211–217.
- Smith P, Chen C, Hogg-Johnson S, Kacur L, Mustard C, Tompa E. Changes in the events and nature of injury associated with no-lost-time claim reports in Ontario between 1991 and 2006: Examining the role of firm-level incentives. 2010. Manuscript in preparation for journal submission.
- Smith PM, Hogg-Johnson S, Mustard CA, Chen C, Tompa E. Comparing the risk factors associated with serious and less serious work-related injuries in Ontario between 1991 and 2006 (in press). American Journal of Industrial Medicine
- Workplace Safety and Insurance Board of Ontario. WSIB Operational Policy Manual (OPM). 2010. http://www.wsib.on.ca/wsib/wopm.nsf/home/opmhome