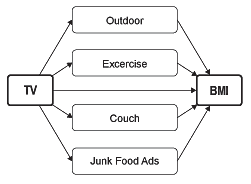
Let’s take the link between watching TV and obesity. As a researcher, how might you learn more precisely how that link works?
You might want to find out whether watching TV affects body mass index (BMI) directly, or whether it affects something else first (e.g. less time spent on exercising, which in turn affects BMI)? Does it affect several other things first, which in turn affect BMI (e.g. less exercising and more exposure to junk food ads)? If several other factors are involved, which of them have more impact than others?
To answer these types of questions, researchers use a method called path analysis to test out the many different ways one thing can affect another. Real-world cause-and-effect relationships are complicated. Path analysis helps researchers measure which of the possible relationships matter the most, and which might turn out to be not important at all.
In a path analysis, you would take the factors (called variables) that might explain what is happening and map them out in a path model. Using our TV and obesity example, your model might look like this:
 Determining what variables to include in the model is your job as a researcher. You’d have to comb through the literature to identify the variables that might play a role. For example, research showing a link between less time exercising and higher BMI would be reason to include exercise as a factor in your model.
Sometimes not much research is available to help. You might then decide to turn to focus groups to help you identify probable pathways.
If the literature on TV watching was scant, for example, you might learn from focus group participants that they hardly go outside or they sit on the couch all the time when watching TV, and that these might be the reasons higher obesity rates are seen among TV watchers.
Testing the model
Once a model is drawn up, the heavy-lifting work of testing the model begins. This is where you would examine available data to find out how well they support your model. To do that, you would run statistical analyses (usually what is known as “regression analysis”) to measure the statistical strength of each pathway.
For example, the data might show that increased TV watching has a strong association with less time exercising, and less time exercising has a strong association with higher BMI. The strength of both relationships indicates that exercise time is an important factor through which TV watching affects BMI. (Researchers sometimes use the term mediating to describe this indirect relationship, one in which a variable acts through another variable—referred to as the mediating variable—to have an impact on something else.)
The data might point to variables in the model that aren’t all that important. For example, you might find a stronger relationship between TV watching and the number of junk food ads people see, but a weaker relationship between the junk food ads people see and BMI. That relationship may be so weak that you decide to drop it altogether from your model.
While statistics can help test your pathway model, they won’t protect you from faulty models. For example, you might find a link between outdoor time and TV time, but neglect to consider that outdoor time might be exerting an impact on TV time instead of the other way around. In a path model, nothing indicates the direction of causality.
Similarly, if important variables are missing from the model, statistics alone might not alert you to that omission. In other words, a model might fit the data, but not necessarily fit reality.
Source: At Work, Issue 74, Fall 2013: Institute for Work & Health, Toronto